MCS 275 Spring 2024 Homework 10
- Course Instructor: Emily Dumas
Deadline
This homework assignment must be submitted in Gradescope by Noon central time on Tuesday March 26, 2024.
Collaboration
Collaboration is prohibited, and while working on this you should only consult the resources (books, online, etc.) listed below.
Content
This assignment corresponds to Worksheet 10 and is about matplotlib.
Resources you may consult
The materials you may refer to for this homework are:
Most likely useful
- Worksheet 10
- Worksheet 10 Solutions - This link will work once the solutions are posted
- Lecture 23 - Julia sets
- Lecture 24 - matploblib 1
- Lecture 25 - matplotlib 2
- Lecture 26 - databases (and a little matplotlib)
- VanderPlas:
- Chapter 2 covers numpy
- Chapter 4 covers matplotlib
- Course sample code repo
- Especially /numpy_matplotlib/
- Allowed, but less likely to be useful:
- Any of the MCS 275 lecture materials, worksheets, previous homework assignments, or solutions to these, if posted on the course Blackboard site.
- Slides from any lecture of my MCS 260 course from Fall 2021.
- Any lecture video posted on the MCS 275 Blackboard site
- Any textbook listed on the course blackboard site under "Textbooks"
Point distribution
This homework assignment has two problems. The grading breakdown is:
| Points | Item |
|---|---|
| 4 | Autograder syntax checks (problem 1) |
| 5 | Problem 2 |
| 5 | Problem 3 |
| 14 | Total |
What to do if you're stuck
Ask your instructor or TA a question by email, in office hours, or on discord.
Problem 2: Sort timing plots
Here are links to two CSV files you should download:
Each one contains timing data for three sorting algorithms:
- The
mergesortwe wrote in class - The
quicksortwe wrote in class - Python's built-in sorting algorithm
Each row of file timing-random.csv shows the time taken by each algorithm to sort a list that is randomly shuffled. The first column of the file, n, is the length of the list for that test.
The file timing-nearlysorted.csv is similar, but for those tests the list used is in "nearly sorted order".
Write a Python script that does the following:
- Reads both CSV files, making suitable numpy arrays to store the data
- Makes two matplotlib plots:
- One showing the timing tests for the three algorithms with random data, with the length of the list on the x axis and the time taken to sort on the y axis.
- One showing the timing tests for the three algorithms with nearly sorted data (axes as above)
- Saves the plots to
timing-plot-random.pngandtiming-plot-nearlysorted.png.
In each plot there should be a title, axes labels, a legend, and the data for each algorithm should appear in a different color. Use dots as markers, and do not have the data points connected by lines.
Choose limits on the y axis so that if one of the tests takes much longer than all the others, it doesn't prevent the other two from being seen in detail. (It's OK if that means the long-running one goes off the top of the plot.)
Put your code in hwk10prob2.py. Upload the code and both images timing-plot-random.png and timing-plot-nearlysorted.png to gradescope.
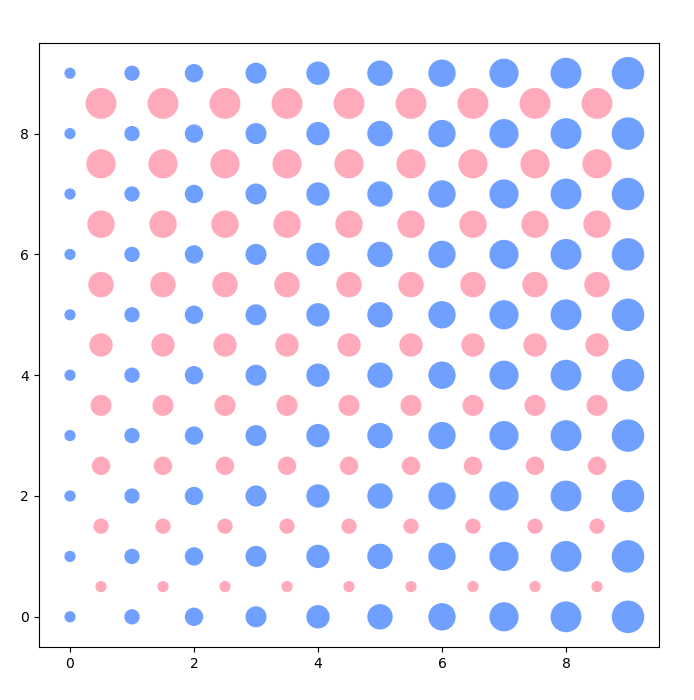
Problem 3: Offset printing
Work in hwk10prob3.py.
Write a Python script to generate a plot as similar to the one below as you can manage. Try to do it with as few for loops as you can manage, favoring numpy features instead. (The code I used to generate it has no loops.)
Hint: You should use plt.scatter.
Put your code in hwk10prob3.py. Upload the code and a PNG image of your plot to gradescope.
Revision history
- 2024-03-14 Initial publication