Lecture 39
Debugging and profiling
MCS 275 Spring 2024
Emily Dumas
Lecture 39: Debugging and profiling
Reminders and announcements:
- Please complete course evaluations.
- Homework 13 due tomorrow
- Updated web apps including Worksheet 13 features available.)
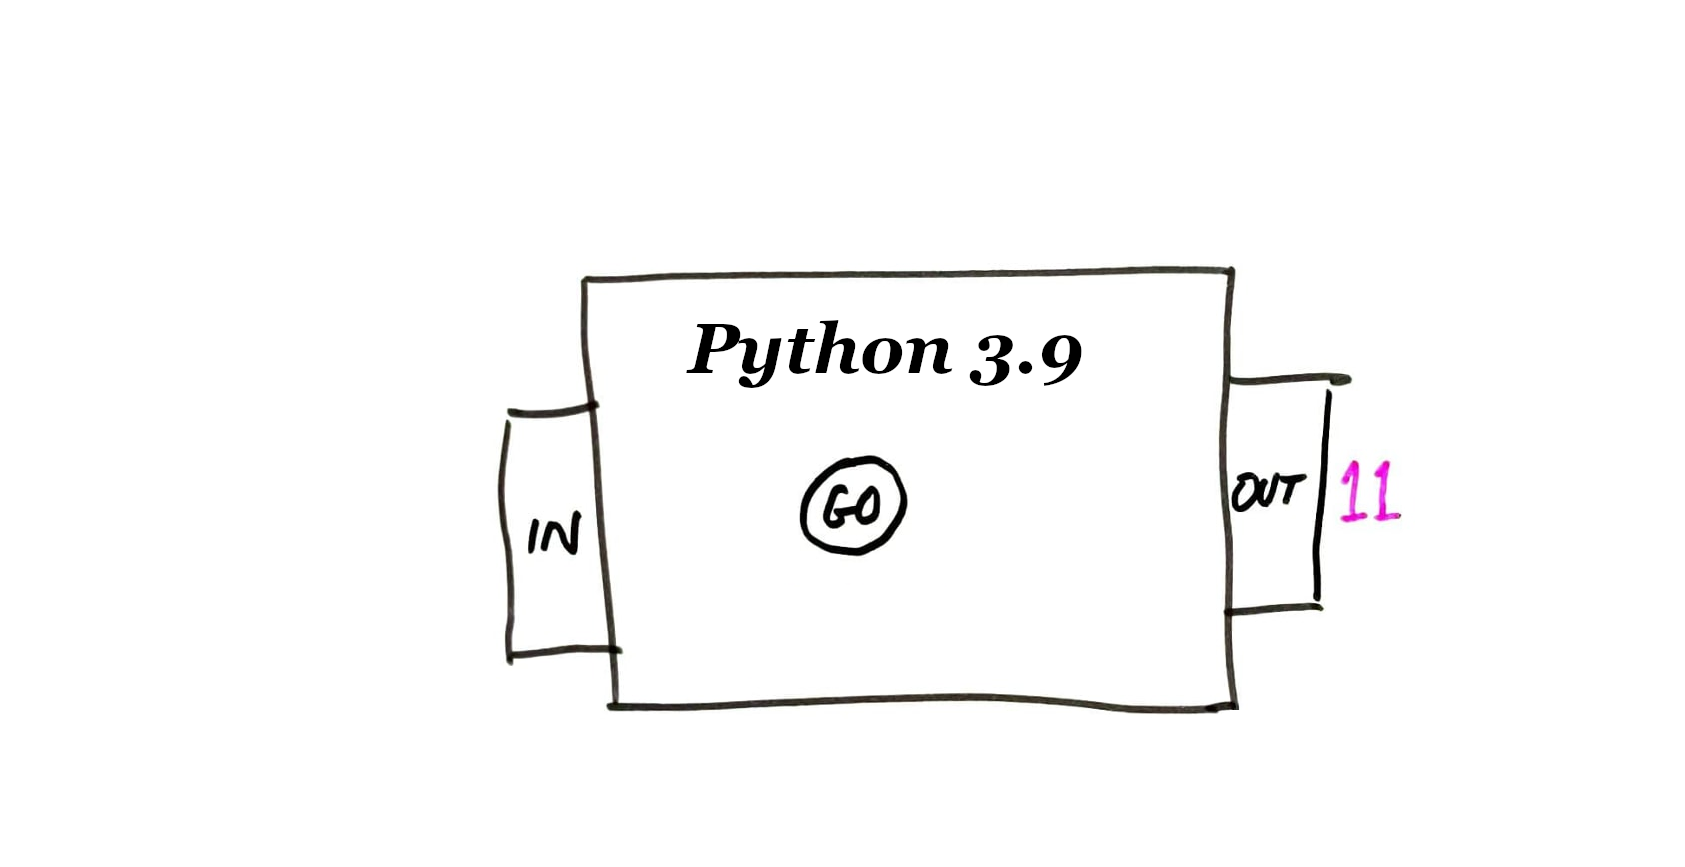
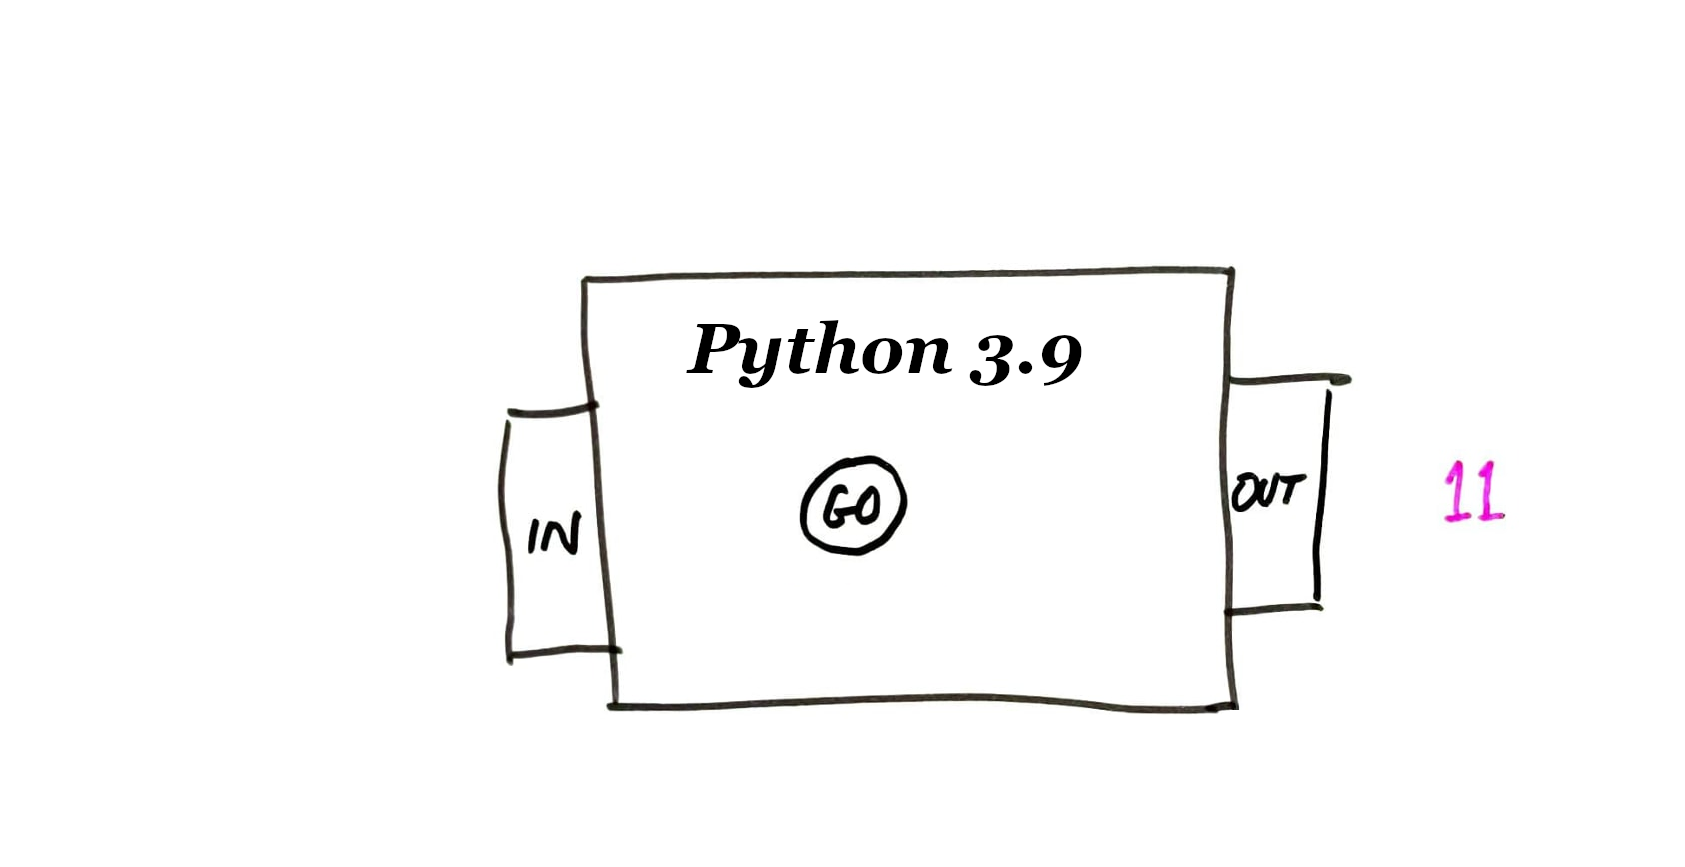
The idea of a debugger
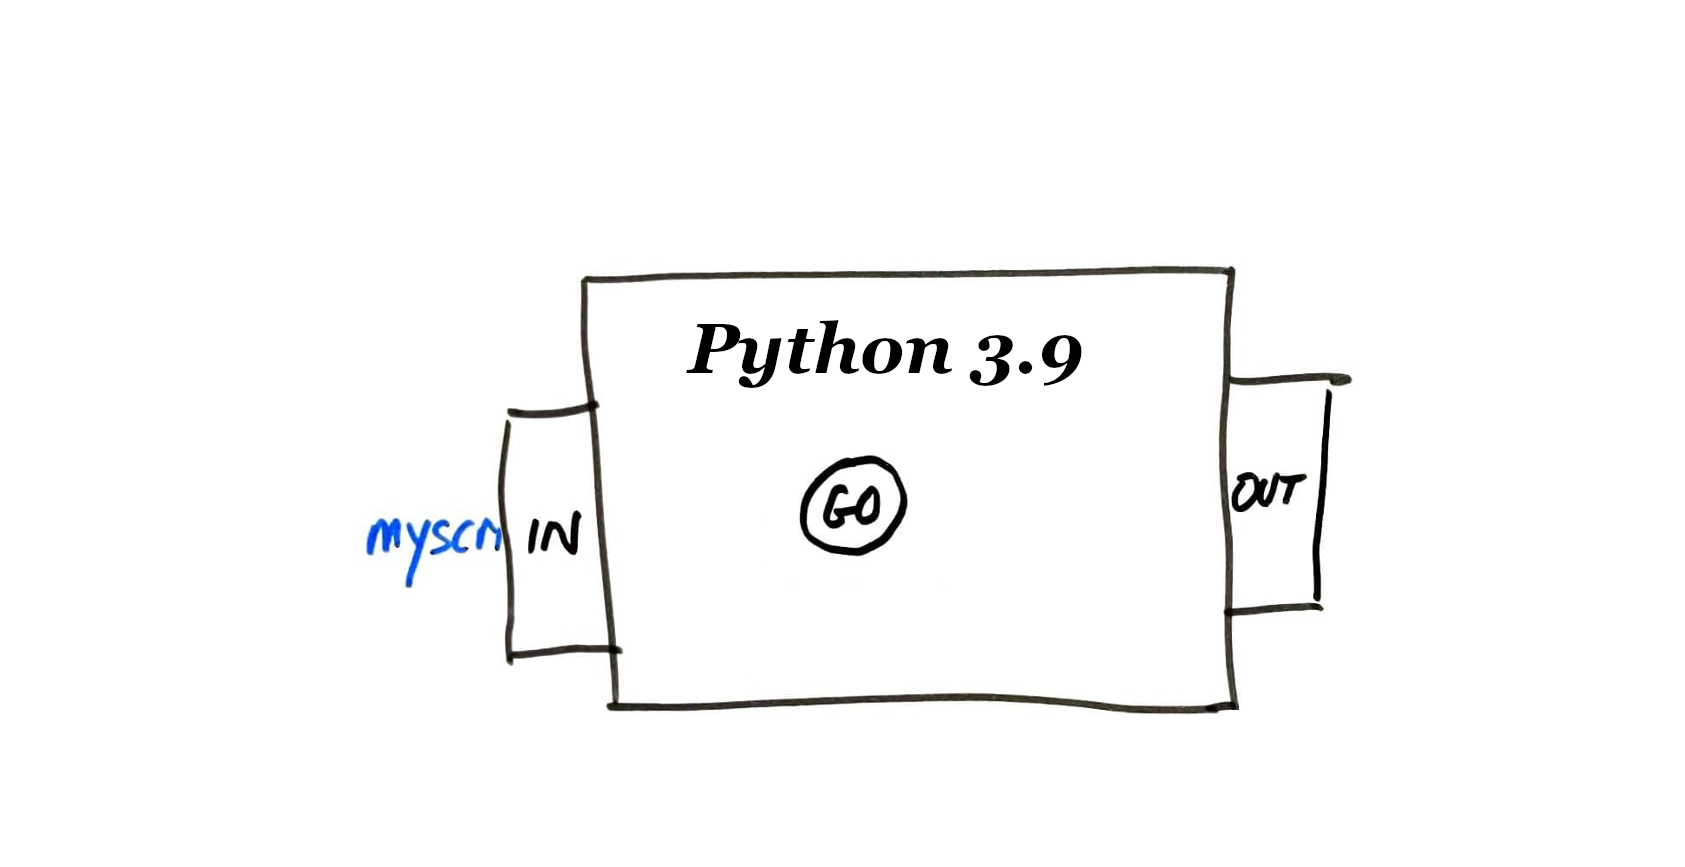
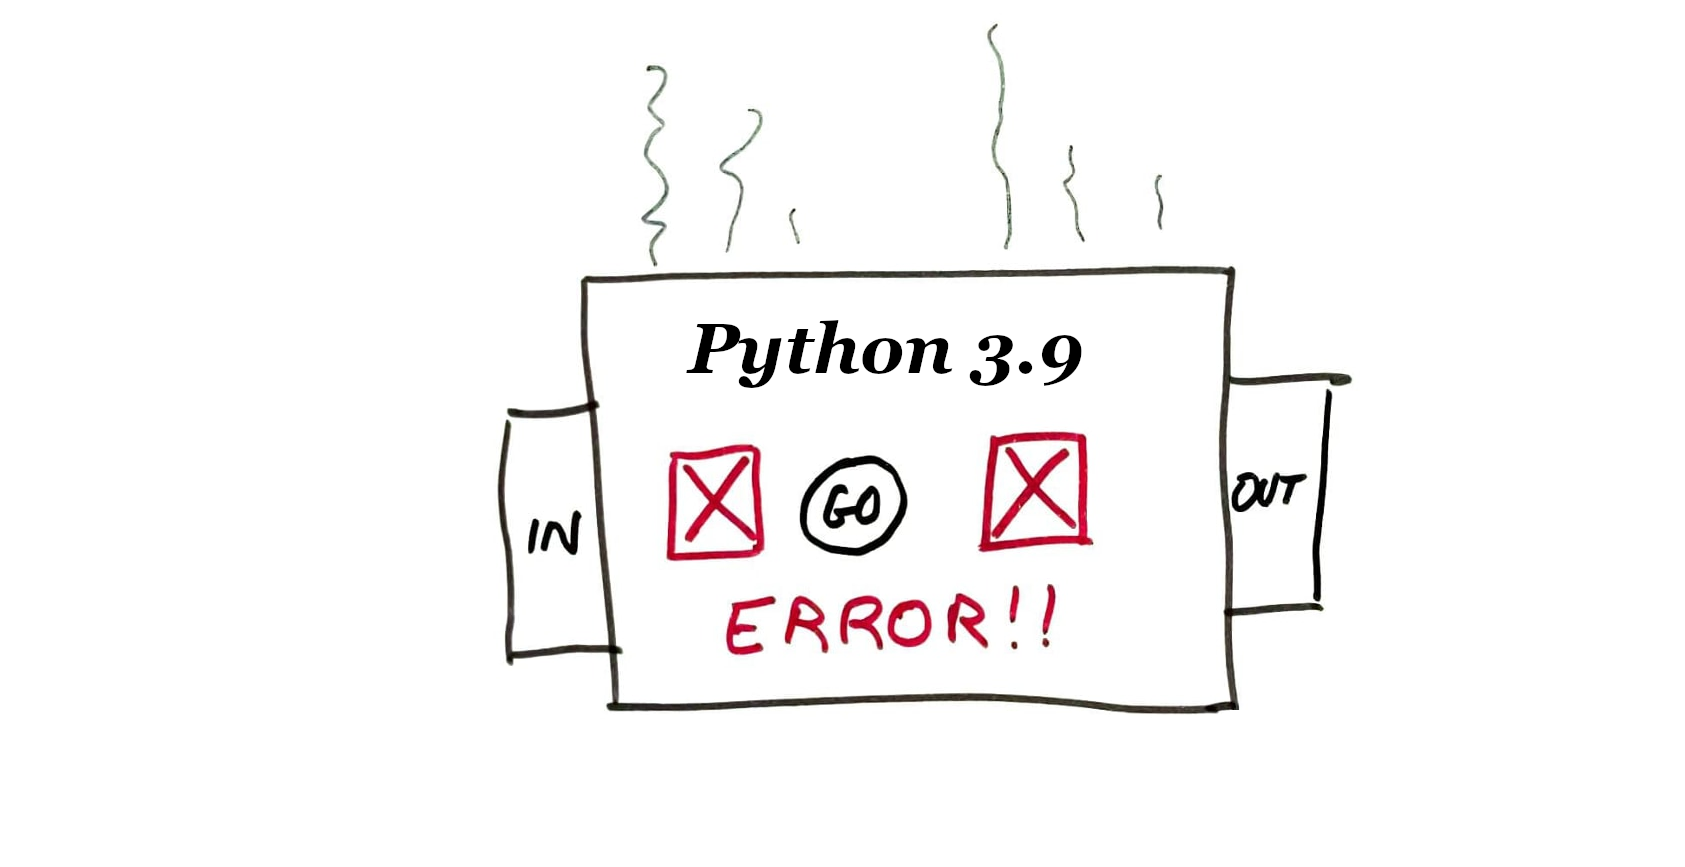
Suppose a Python program has a bug.
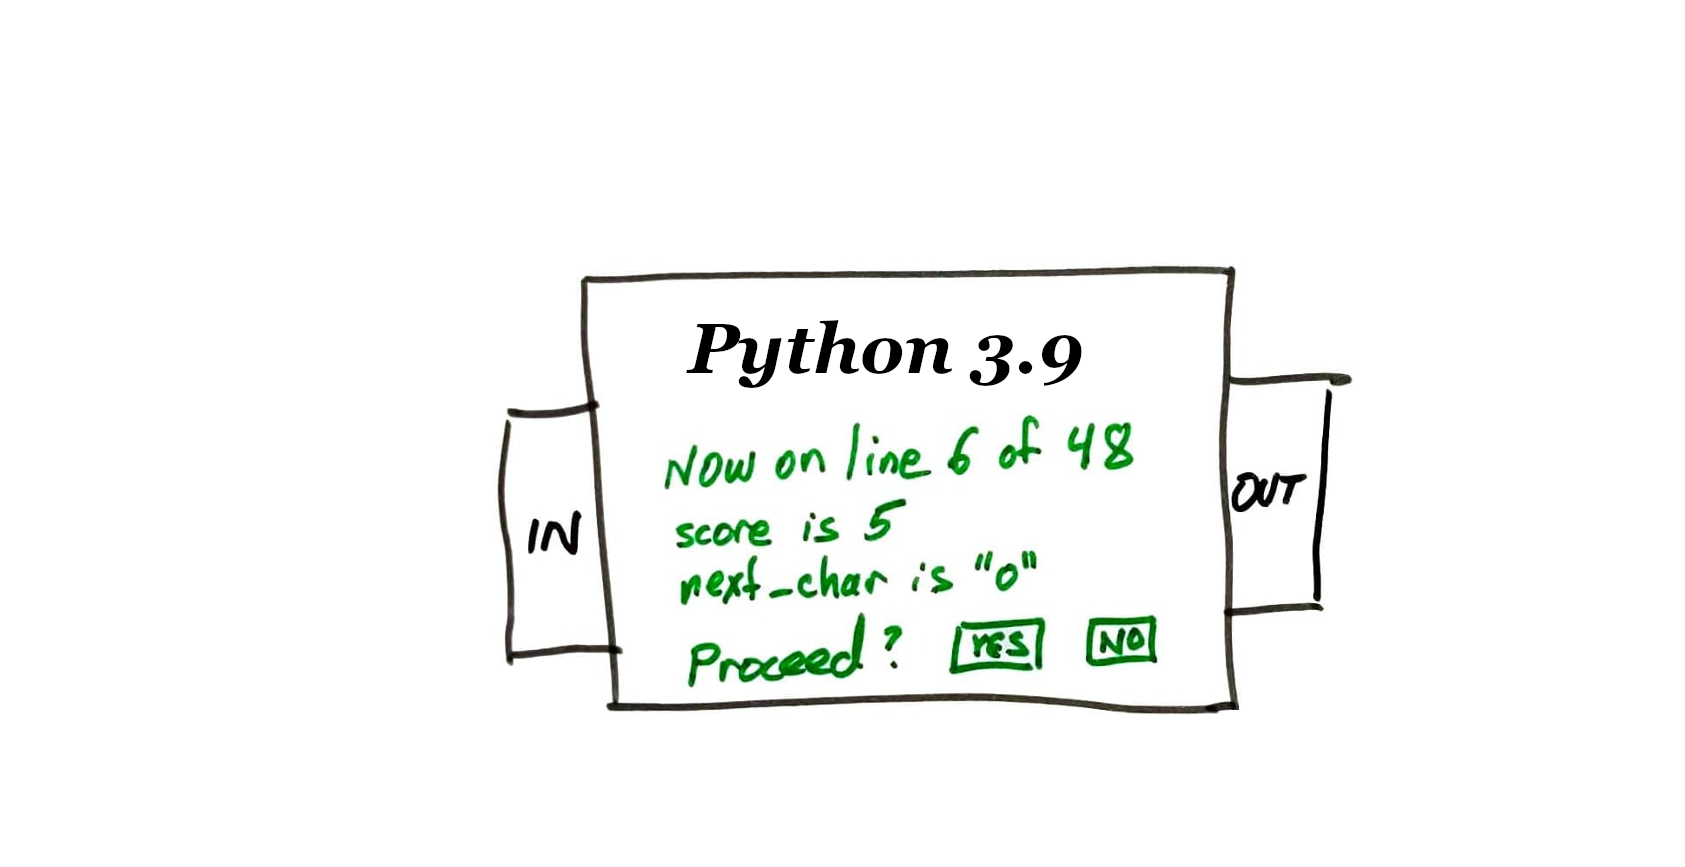
Wouldn't it be nice if you could run the program slowly, monitoring values of variables along the way?
pdb
The built-in Python debugger, called pdb, makes this possible. Key features:
- Single-step through a program
- Inspect values of variables
- Run normally until a certain line is reached
- Analyze an exception that is about to end the program.
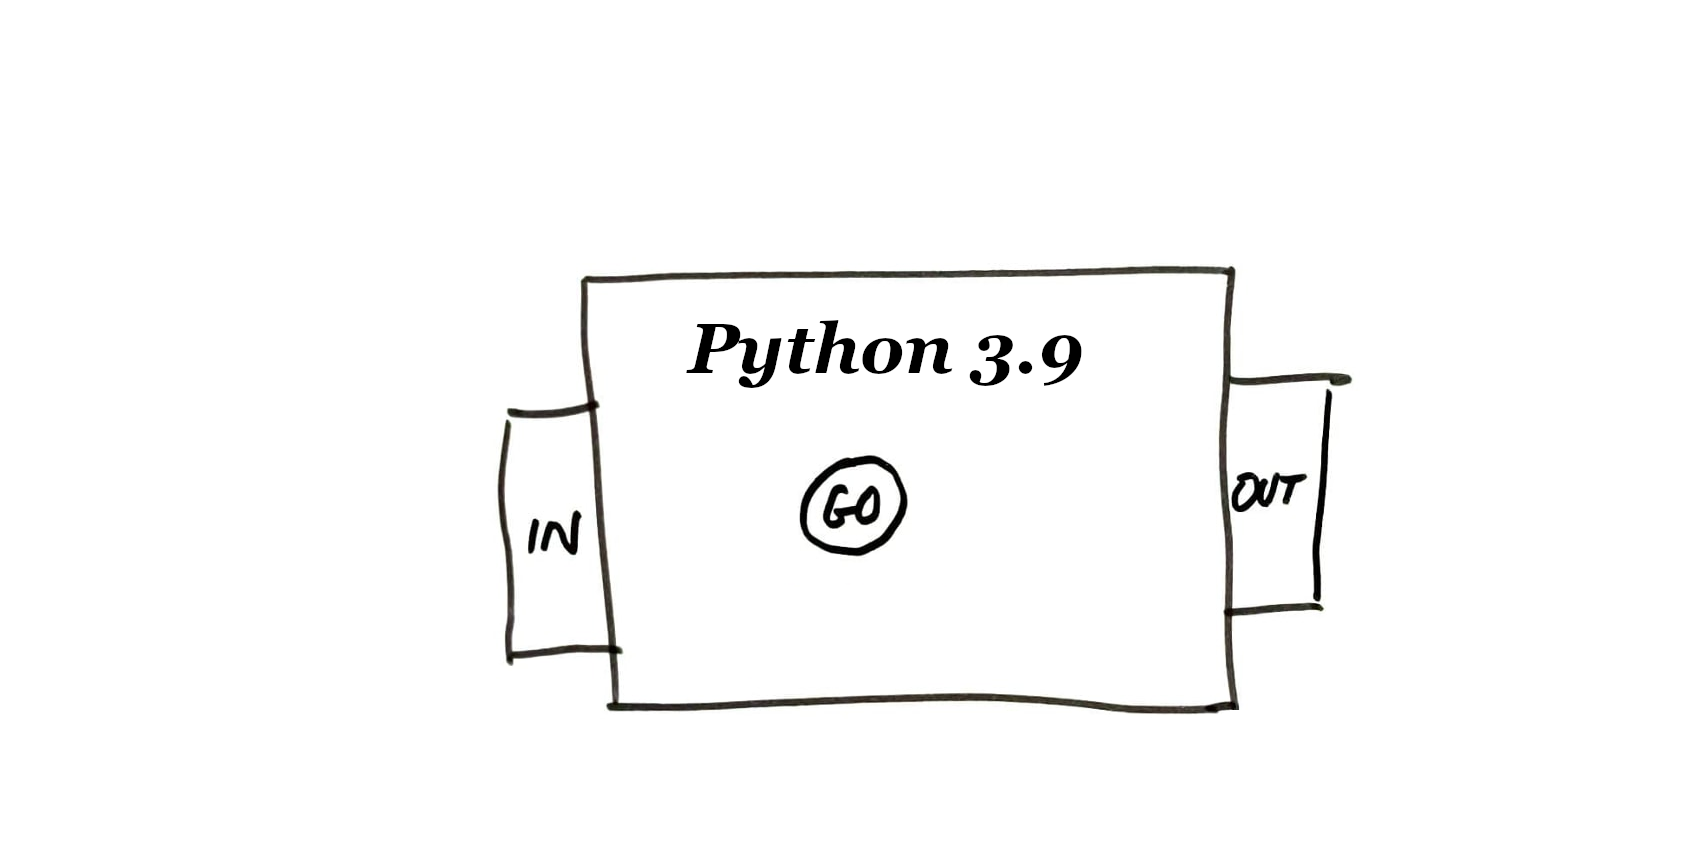
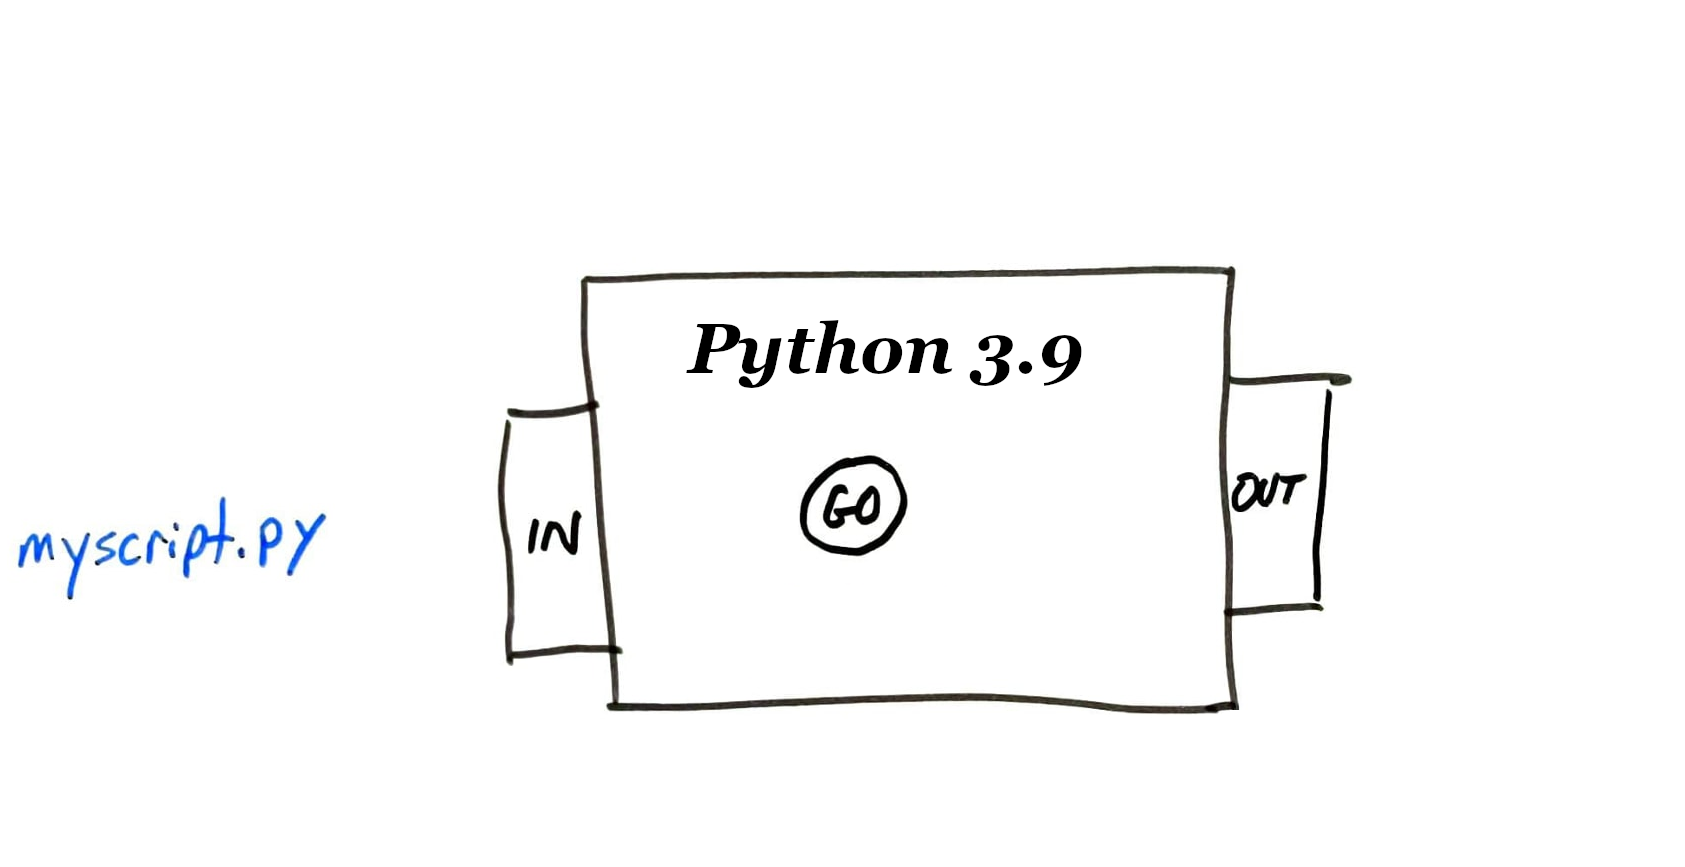
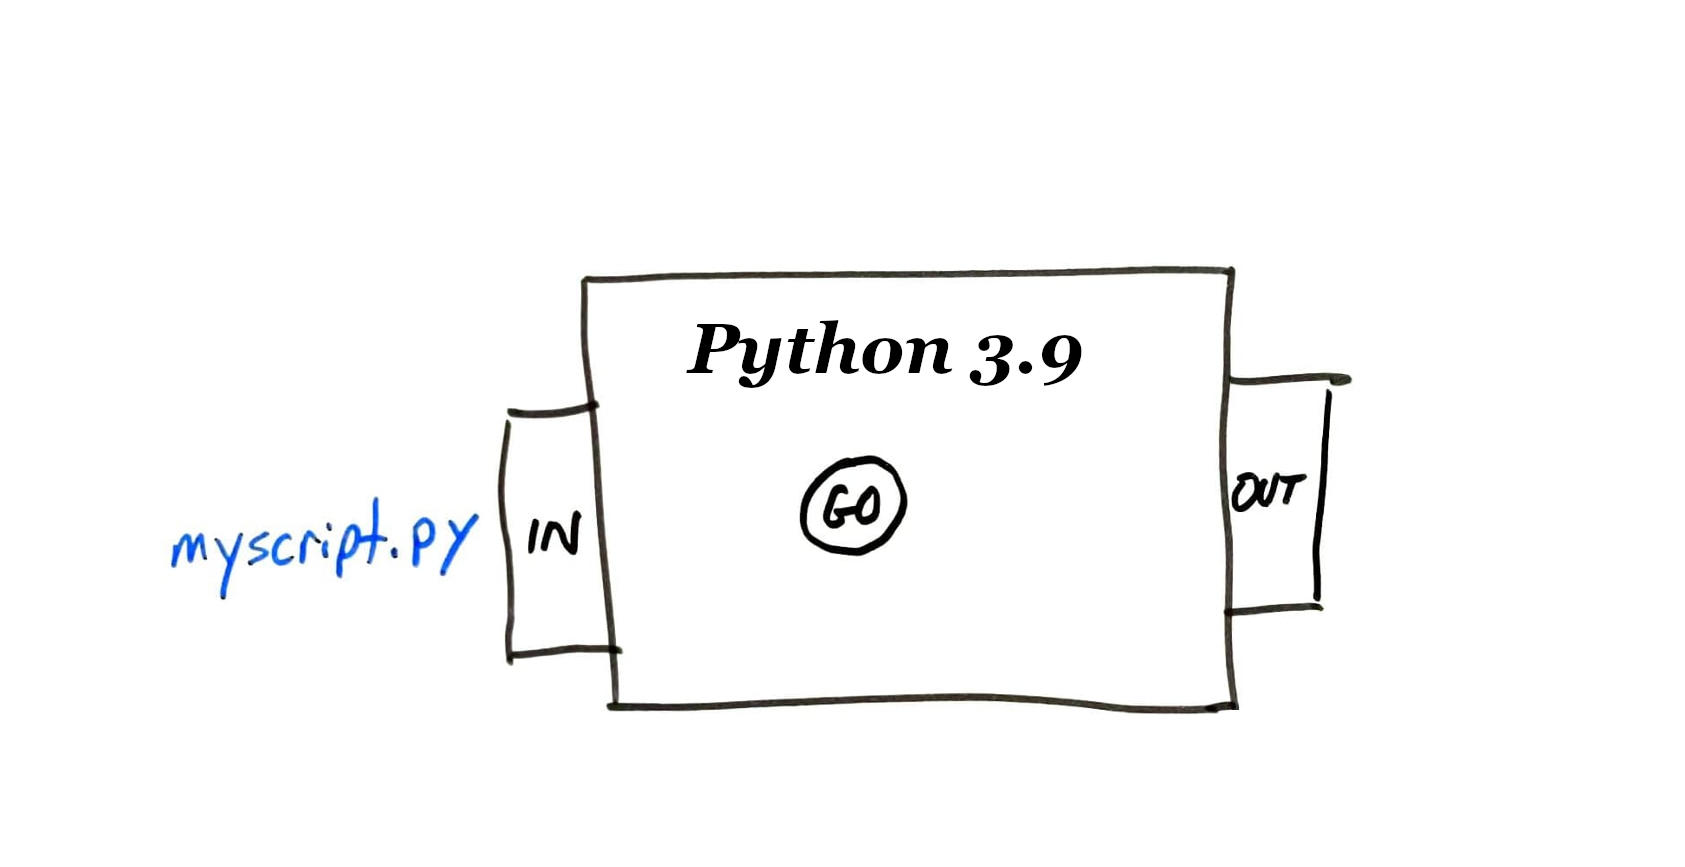
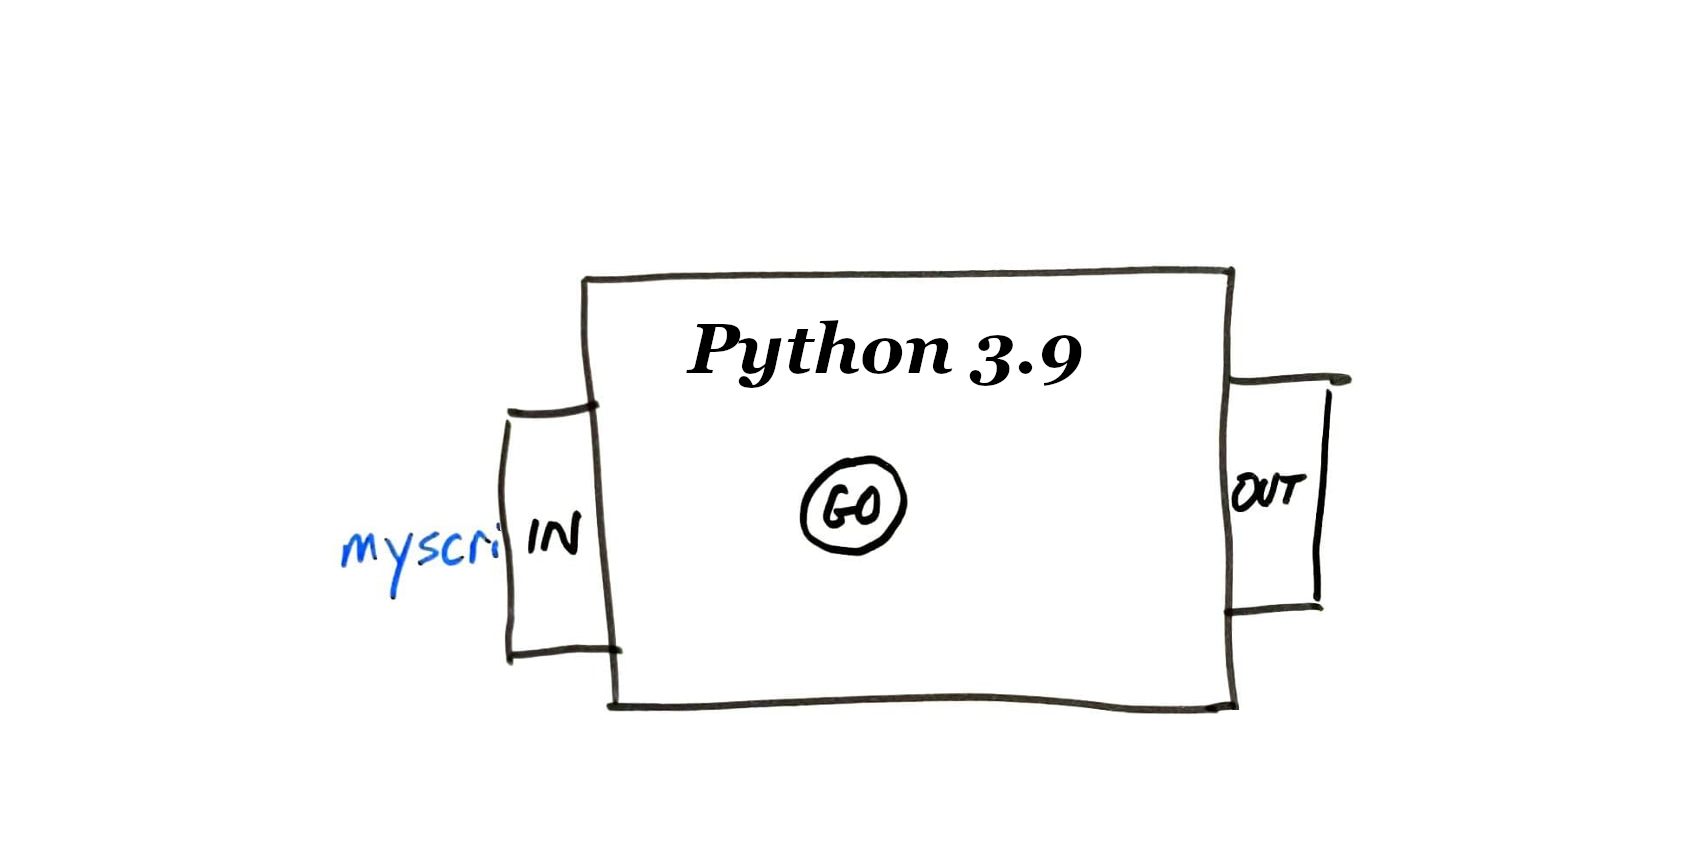
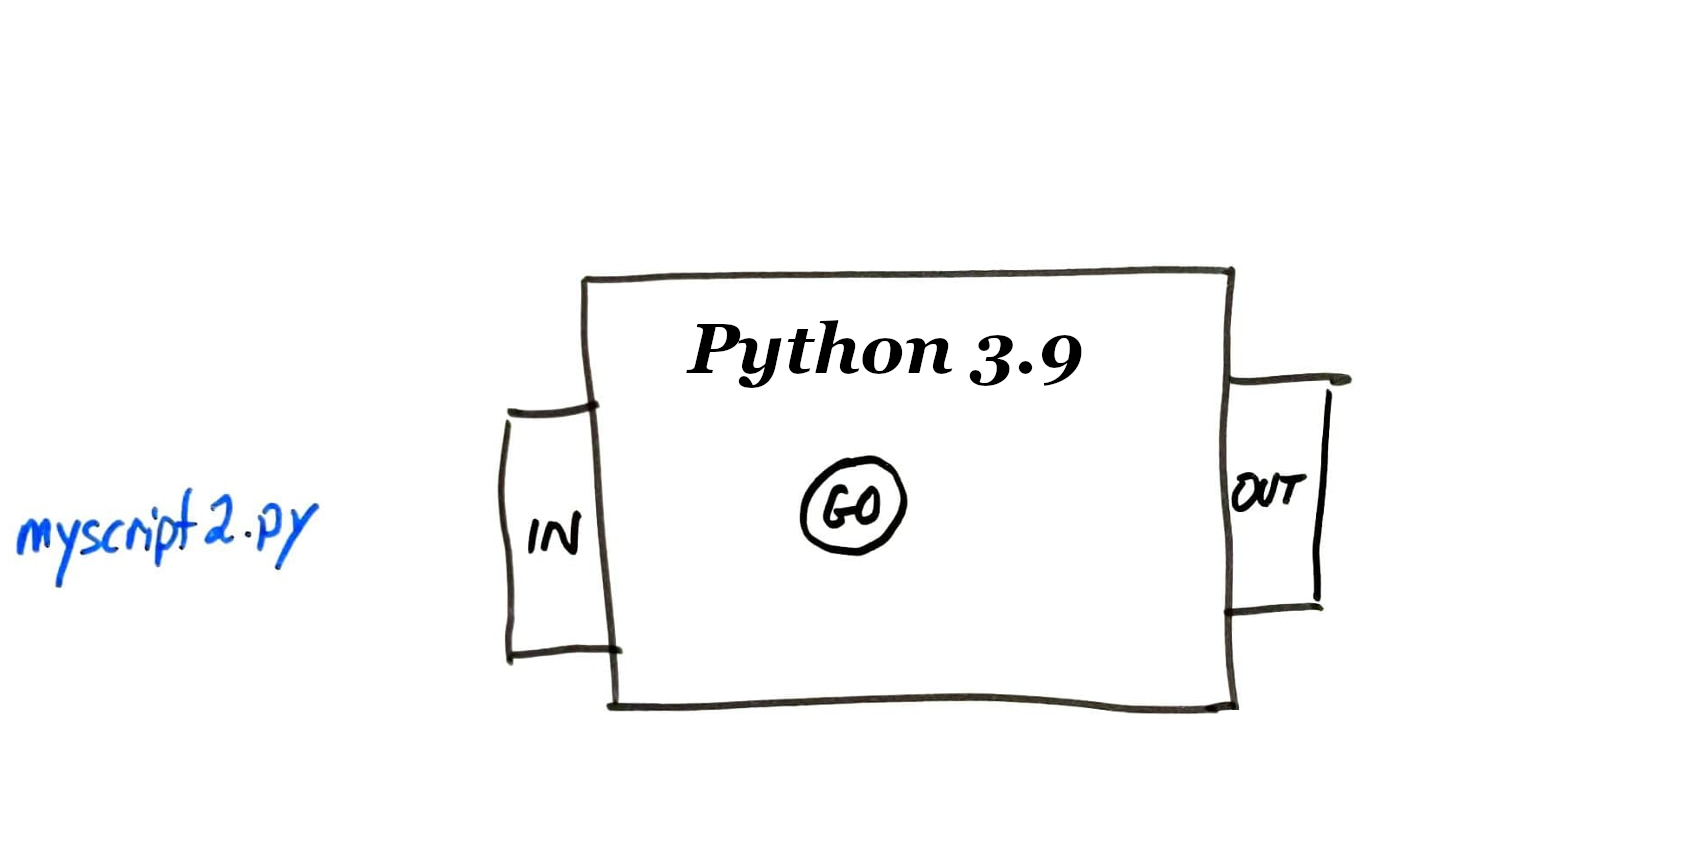
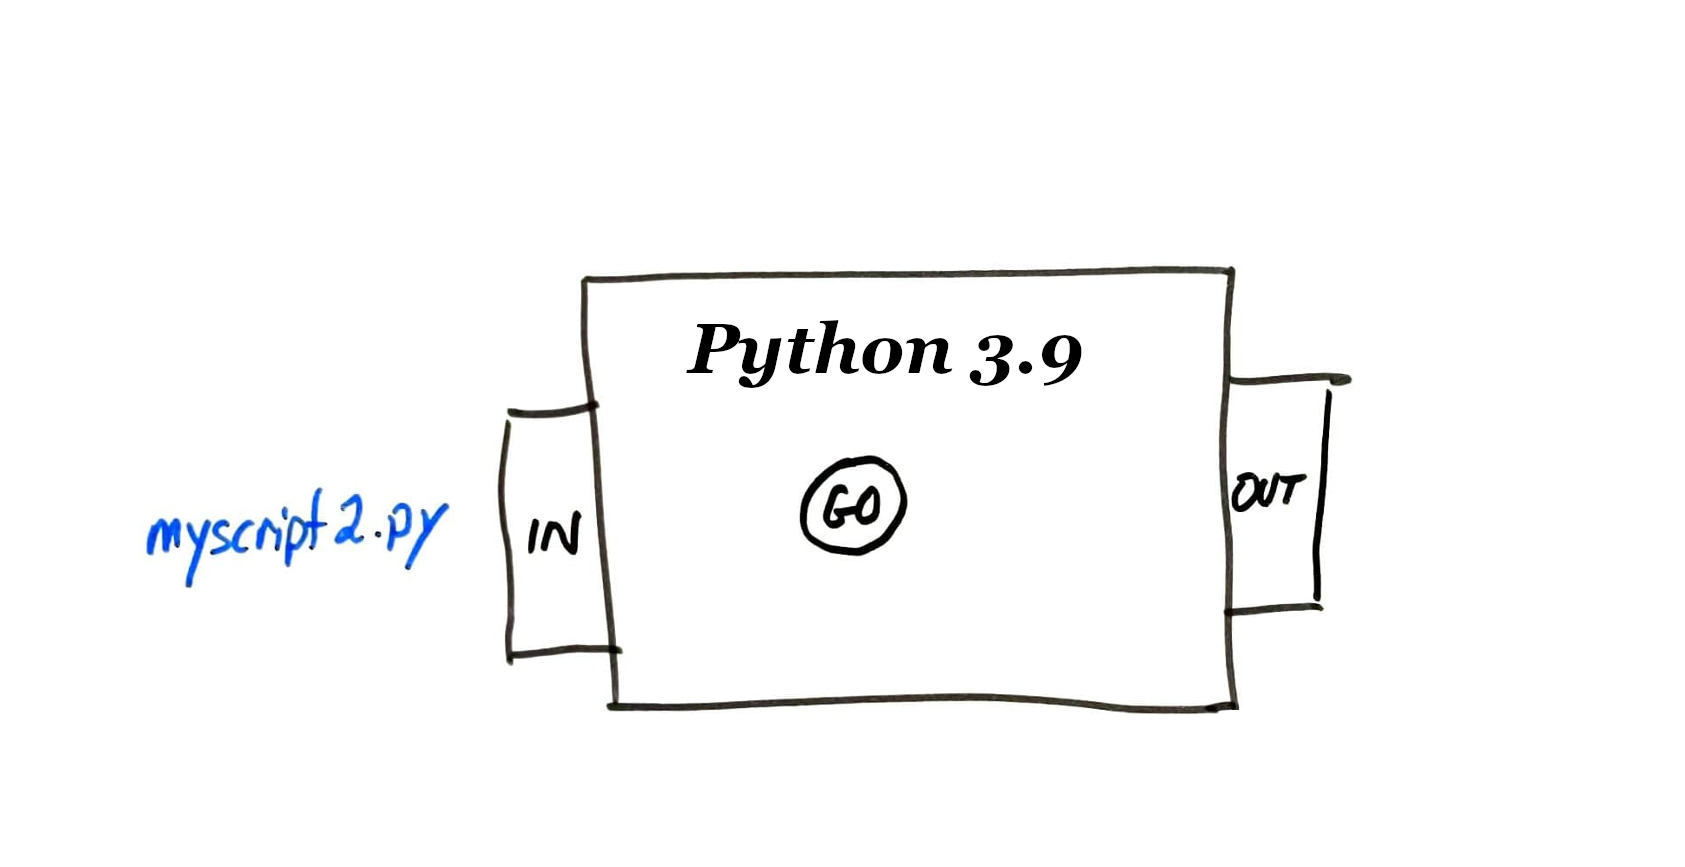
Running pdb
python -m pdb myprogram.py alpha beta 3Runs myprogram.py with command line arguments ["alpha","beta",3], but in the debugger.
The program starts in a paused state, and a prompt is shown where we can enter commands (to resume, run a single line, show values of variables, etc.)
pdb basics
Running the program:
- c or continue -- Start or continue running the program, i.e. "unpause".
- s or step -- Start execution but stop as soon as possible. If a function is called, move to the first line of that function.
- n or next -- Start execution and stop when the next line of the current function is reached. (If the current line calls other functions, wait for them to return.)
- r or return -- Start execution and stop when the current function returns.
Inspecting the situation:
- l or list -- Show a passage of source code that includes the current line.
- ll -- Show the entire contents of the file containing the current line.
ppEXPR-- EvaluateEXPRand display the result nicely ("pretty print")displayEXPR-- Every time execution is paused, show the value ofEXPRif it has changed.
Breakpoints
Rather than single-stepping, it is often helpful to keep running until a certain part of the code is reached.
A place where execution is supposed to stop and return control to the debugger is a breakpoint.
bFILE:LINE_NUM-- Set breakpoint by line.bFUNCTION_NAME-- Set a breakpoint by function name.cl-- Clear all breakpoints.
Post mortem
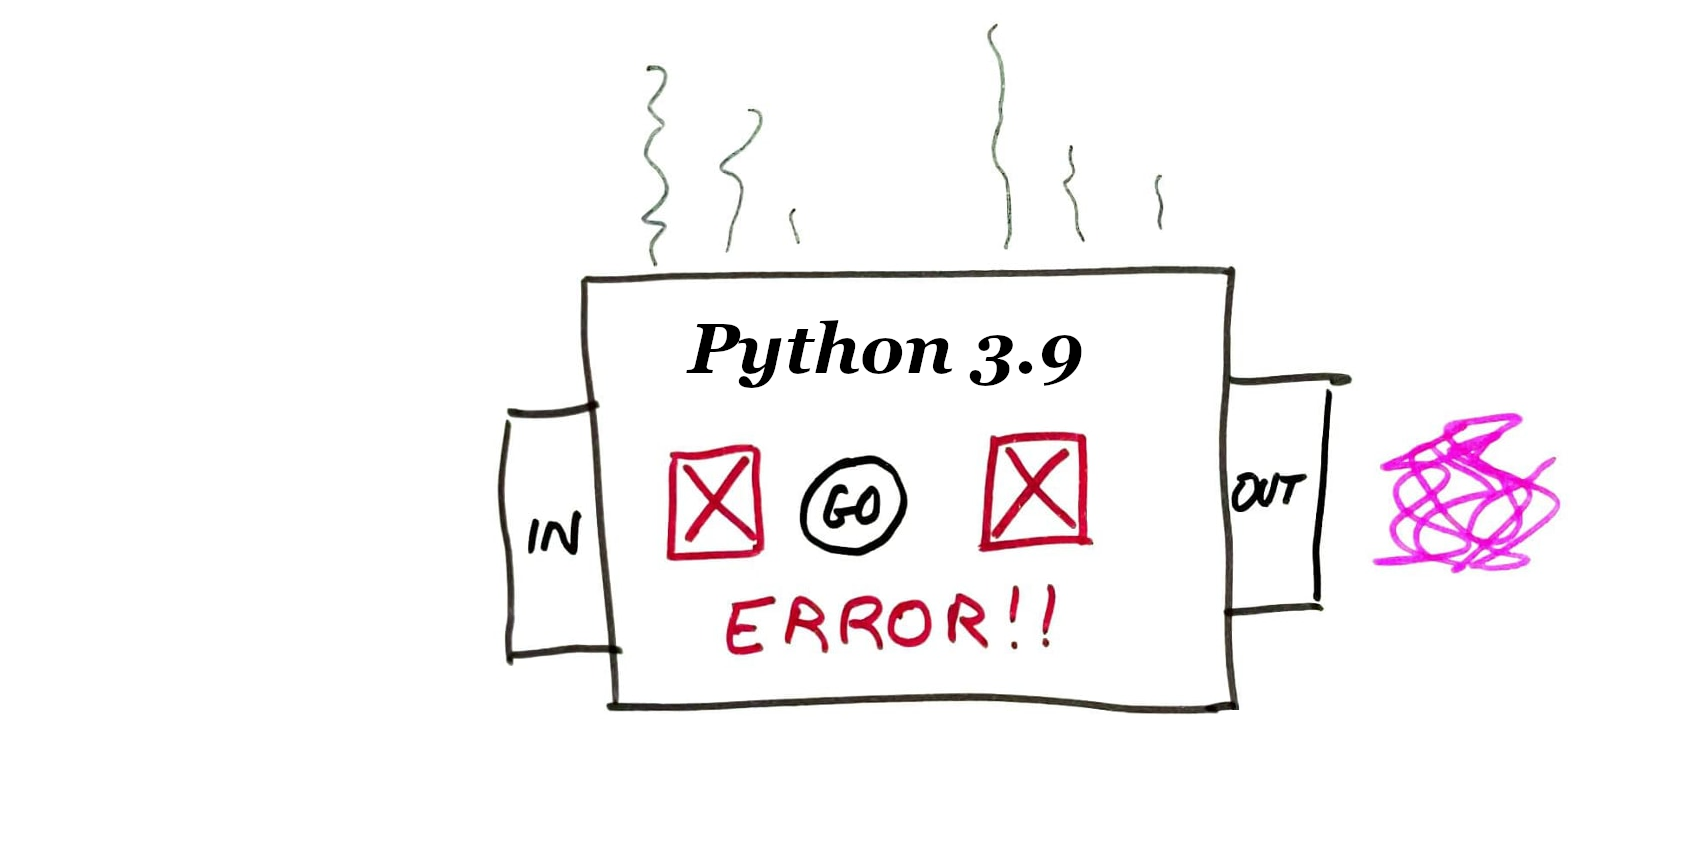
If an uncaught exception occurs when a program is running in pdb, the debugger pauses at the moment of the exception to let you investigate.
This is called a "post mortem" (after death) investigation of the program. You can't continue or step, but you can examine the values of variables, etc.
Moving around the call stack
What if f() calls g(), and you are paused inside g but want to know the value of a local variable of f?
uorup-- Move one step up the traceback, to the function which called this one.dordown-- Move one step down the traceback, to the function which called this one.worwhere-- Show the current traceback.
These let you explore the contents of the call stack (the function calls currently in progress).
Profiling
Measuring the amount of time various parts of a program take is called profiling.
Usually you should focus on correctness first, then profile before considering optimization (changing code to make it faster).
cProfile
Python has a built-in profiler, called cProfile. Its basic usage looks like:
python -m cProfile myprogram.pyIt runs myprogram.py and displays a report in the terminal after that script exits.
Profiler report
Lines in the report are functions. Columns:
- ncalls - Number of times the function is called
- tottime - Time at the top of the call stack.
- percall - Shows tottime / ncalls
- cumtime - Time in the call stack.
- percall - Shows cumtime / ncalls
To sort by one of these, add -s FIELDNAME after -m cProfile and before the script name.
Saving profile data
Often it is better to run a program and save timing data to analyze later:
python -m cProfile -o myprogram.cProf myprogram.pyThe module pstats can load, organize, and print the data.
Graphical view
python3 -m pip install snakevizThen you can browse the profile data via:
python3 -m snakeviz profiling_data_file.cProfReferences
- pdb and cProfiler are not discussed in any depth in the optional texts.
- The official pdb documentation
- The official cProlfer documentation
- This Tutorial on the Python debugger by Lisa Tagliaferri at DigitalOcean is nice.
Revision history
- 2022-02-04 Finalization of the 2022 lecture this was based on
- 2024-04-15 Initial publication